Improving water quality in wastewater treatment plants


Wastewater treatment plant upgrades result in decreased nitrogen and phosphorus into Chesapeake Bay

Following implementation of the Clean Water Act and the National Pollutant Discharge Elimination System permits, upgrades to wastewater treatment plants have led to many instances of improved water quality. Greater investment in improved water treatment technology will lead to further water quality improvements and help offset the additional pressures of a growing urban and suburban population.

Wastewater treatment plant upgrades in the Potomac River and Patuxent River watersheds resulted in reductions in phosphorus and nitrogen concentrations, which led to recovery of aquatic seagrasses in some tidal areas.
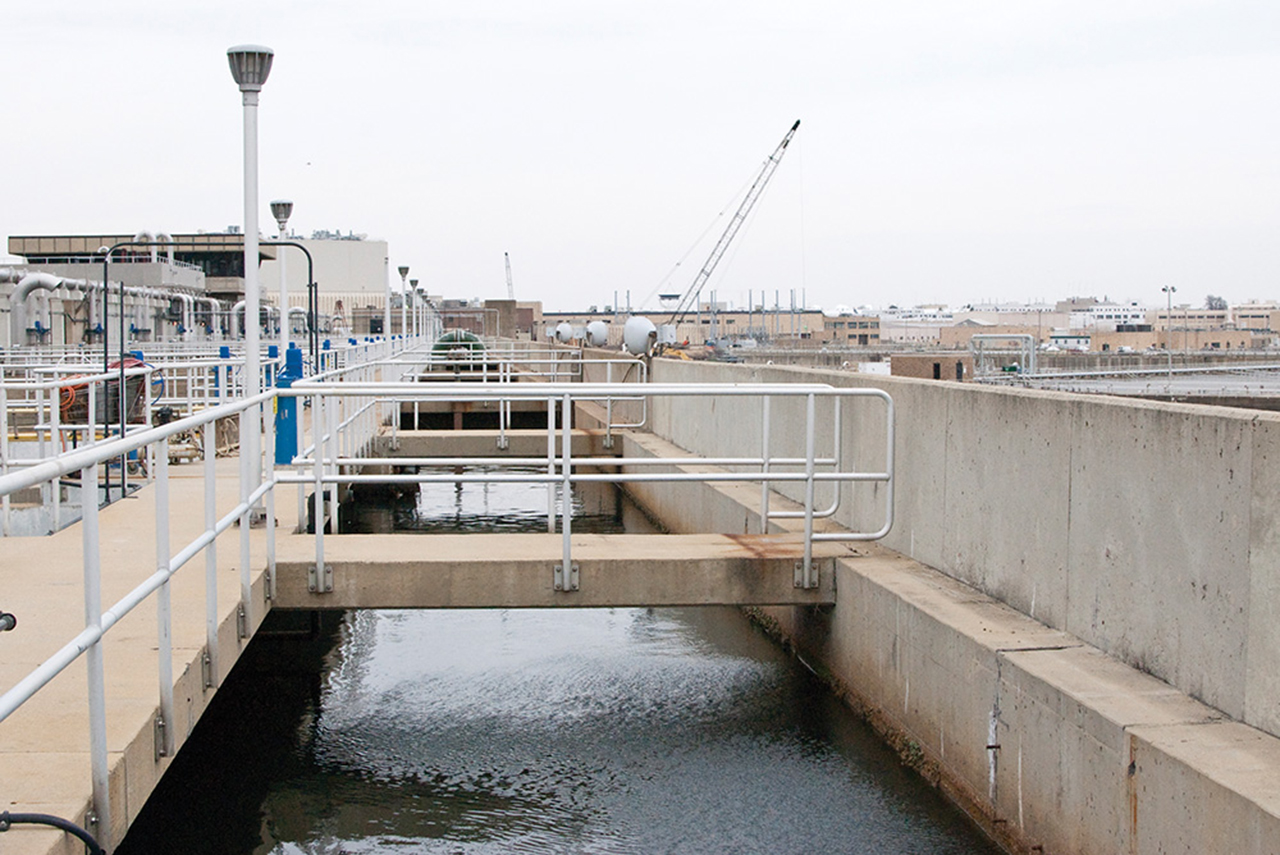
Photo of tanks of dark-colored water at a wastewater treatment plant.
Serving the DC metropolitan area since 1983, the Blue Plains Wastewater Treatment Plant has been upgrading its wastewater treatment technologies.
Line graph showing Total Nitrogen Load on the y-axis and Year: 1895 to 2003 on the x-axis. Total Nitrogen Load is high (between 2000 and 3000 kilograms per day) from 1895 to 1991. A red line at 1991 marks the installation of Biological Nutrient Removal technology. From 1991 to 2003, Total Nitrogen Load is significantly lower and varies more year to year, mostly between 500 and 2000 kilograms of total nitrogen per day.
In 1991, nitrogen loads decreased when biological nutrient removal (BNR) technology was implemented at a wastewater treatment plant in the upper Patuxent River watershed. Source: Chesapeake Bay Program.


Reducing agricultural runoff


Reductions of agricultural nutrient input can improve water quality and habitat in as little as 1-6 years

Agriculture is the source of 42% of the nitrogen and 46% of the phosphorus found in the Chesapeake Bay. Reducing agricultural nonpoint nutrient sources has presented a challenge due to the complex nature of diverse agricultural practices throughout a watershed characterized by varied landscapes and geology.

Despite this difficulty, a number of best management practices (BMPs) have been proven effective in reducing nutrient loads from agricultural lands and improving local water quality. These practices include appropriate manure and fertilizer management, planting winter cover crops, and controlling livestock access to streams.
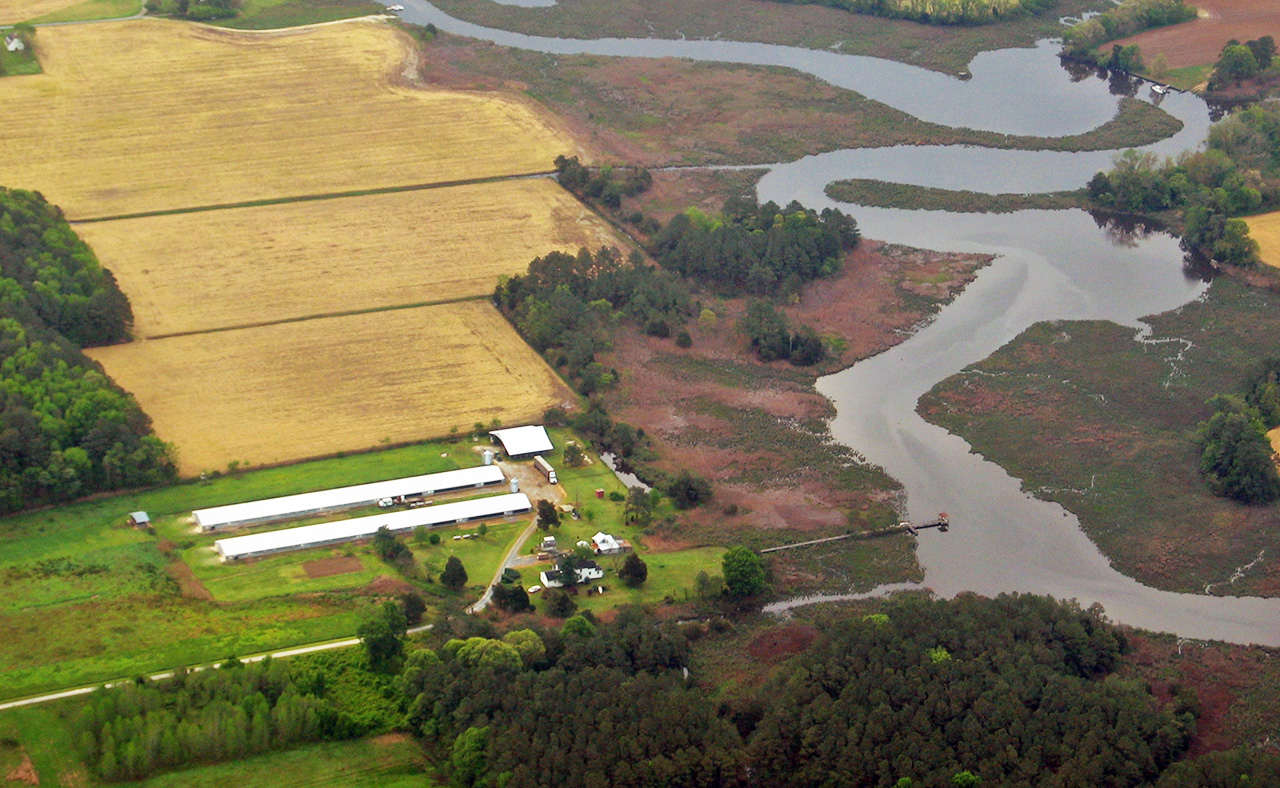
Aerial photo of a poultry farm and farm fields next to a winding stream.
Poultry litter is a source of nutrients that can negatively affect water quality by entering rivers and the Chesapeake Bay through runoff and groundwater.
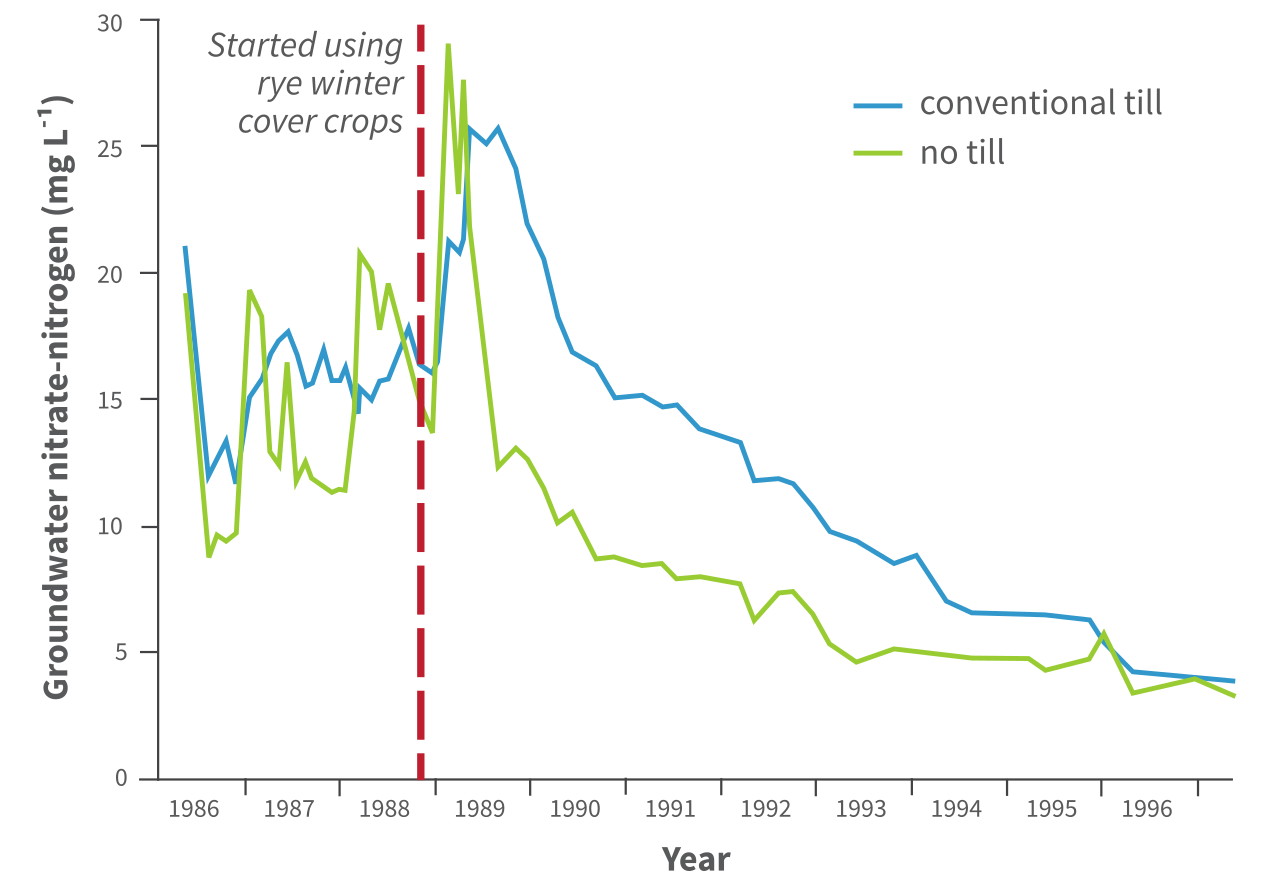
Multi-line graph showing Groundwater Nitrate-Nitrogen on the Y axis and Year: 1986 to 1996 on the x-axis. The two lines on the graph the groundwater nitrate-nitrogen measured in two adjacent agricultural fields where rye was planted as a winter cover crop, the blue line with a conventional till method and the green line with a no-till method. A vertical red line demarcates when the rye cover crop was planted. The no-till method resulted in lower groundwater nitrate-nitrogen than the conventional till method, but both fields experienced a long-term reduction in groundwater nitrate-nitrogen from the rye cover crop.
Winter cover crops were planted in 1988 on two adjacent agricultural fields within the Wye River watershed, resulting in significant decreases in average groundwater nitrate-nitrogen. Source: MD Department of Natural Resources.


Reducing phosphorus loads into the Bay


PHOSPHORUS IS A PRIME POLLUTANT OF STREAMS AND THE CHESAPEAKE BAY

Though found in nature, too much phosphorus acts like fertilizer and spurs the growth of algae. When the algae die, their decomposition depletes oxygen needed by the fish, crabs, and other marine life of the Chesapeake Bay.
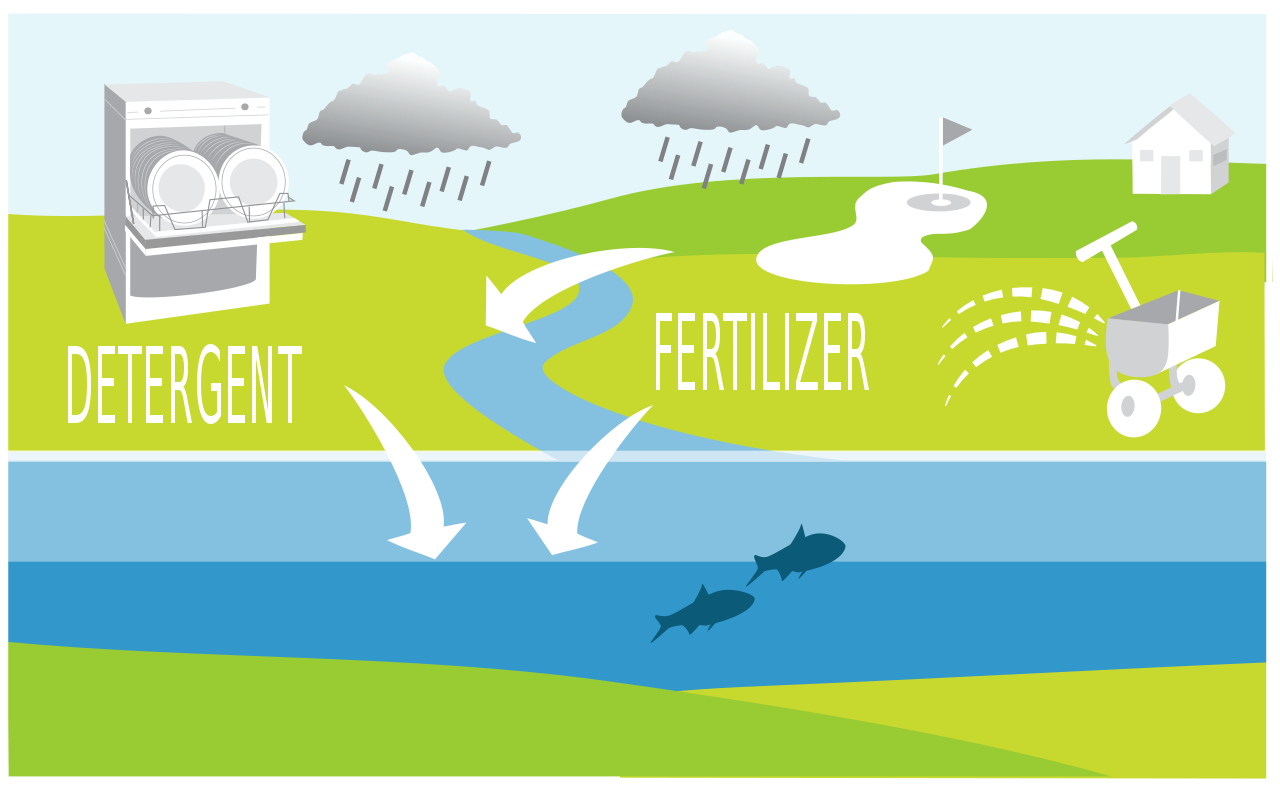
Illustration showing sources of phosphorus flowing into the Chesapeake Bay: a dishwasher with the word “Detergent” and a golf course, house, and broadcast spreader with the word “Fertilizer.”
IN 1985, MARYLAND BANNED PHOSPHORUS IN DETERGENTS

In 1985, it was estimated that 9% to 34% of phosphorus going into sewage treatment plants came from residential dishwashing detergent, and as a result, Maryland and DC joined several other states by banning or substantially reducing phosphate from detergent products. Since then, phosphorus loads from wastewater treatment plants have declined by 72%.
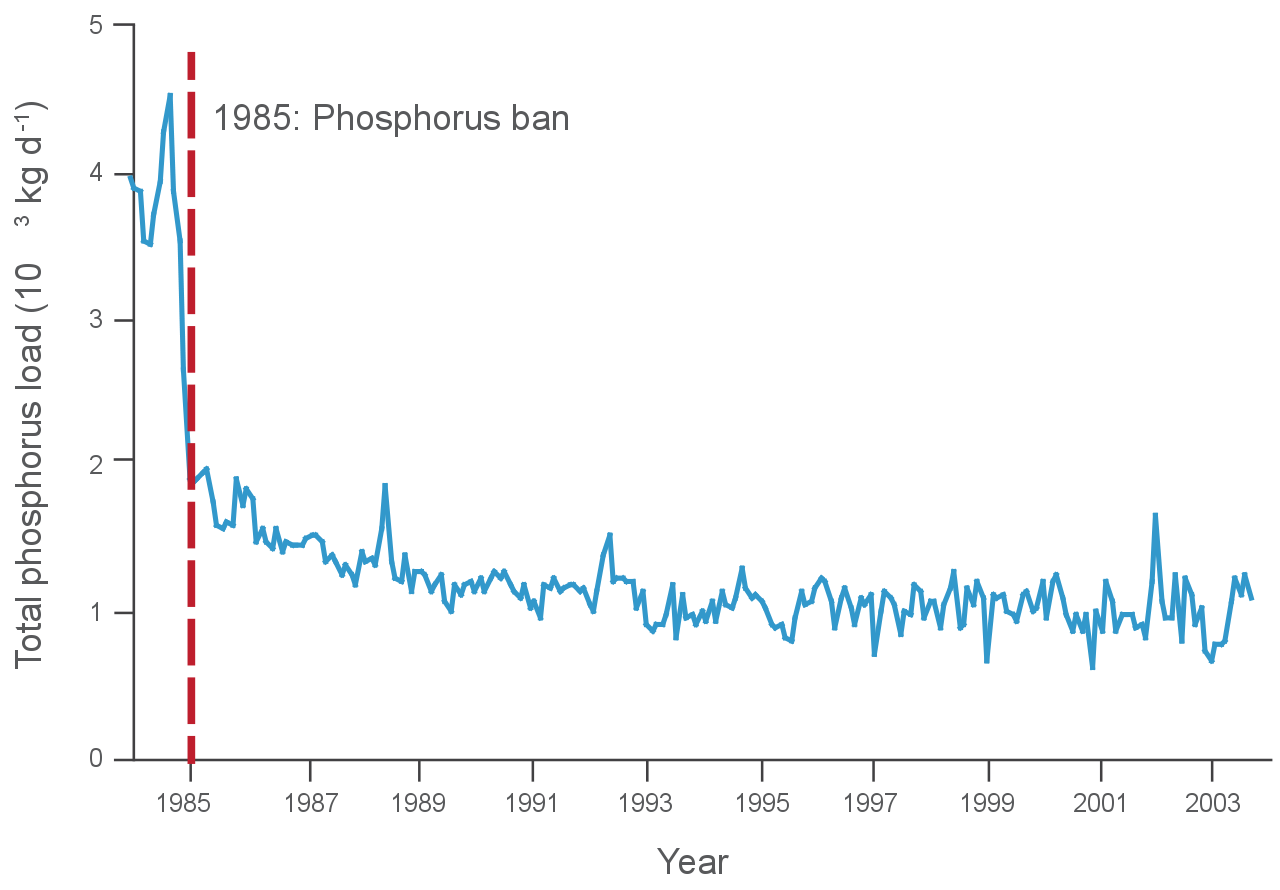
Line graph with Total Phosphorus Load on the y-axis and Year: 1985 to 2003 on the x-axis. A vertical dashed red line demarcates when the phosphorus ban was instituted in 1985. The blue line representing total phosphorus over time drops sharply after the ban, from around 4000 kilograms of phosphorus per day before the ban to 1000 to 2000 kilograms per day after the ban.
IN 1985, MARYLAND BANNED PHOSPHORUS IN LAWN FERTILIZERS

Lawns, parks, golf courses and other grass-covered areas cover 3.8 million acres of the Chesapeake Bay watershed. Most established lawns do not need phosphorus, but the majority of commonly used lawn fertilizers include phosphorus in their nutrient mix.

Passed in 2011, Maryland’s lawn fertilizer law limits the amount of nutrients that can be applied to lawns or turf, and restricts phosphorus content in lawn fertilizer.

The goal is to help homeowners and lawn care professionals maintain healthy lawns without applying excess amounts of nitrogen and phosphorus that may end up polluting the Bay.

Image from the Midshore Riverkeeper Conservancy with a picture of a river with grass on the side and the text “Reduce lawn fertilizer, Heal our rivers.” A man with a broadcast spreader for fertilizer has been photoshopped into the river and there is a red X over the broadcast spreader.